


Yoel Kortick, Senior Librarian, Ex Libris
What if you could instantly see how your library was performing compared to other libraries the world over? Surely, that kind of benchmarking would provide valuable insight into where you should focus improvement efforts and where your library is already topflight.
It would be even more informative if the data could be sorted by type of library and tracked over time. You’d be able to identify trends or hidden issues early on, so you could quickly meet developing needs or take preemptive corrective action.
It is exactly that sort of powerful, forward-thinking innovation that we at Ex Libris provide as a standard part of our solutions.
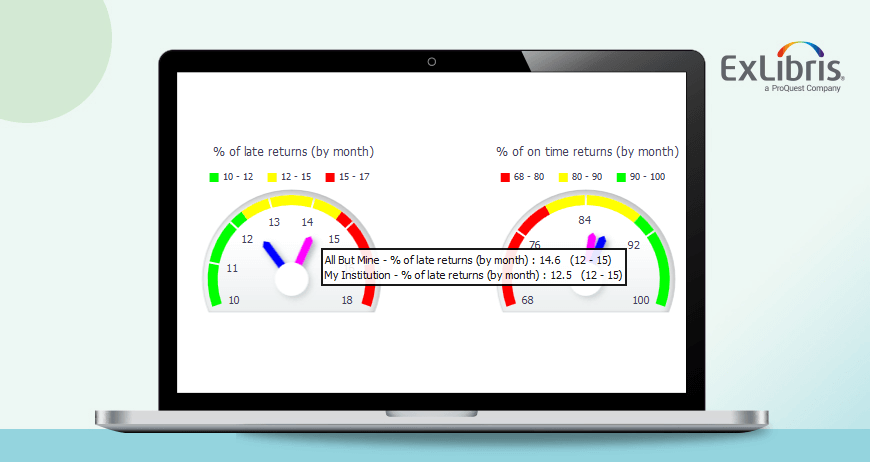
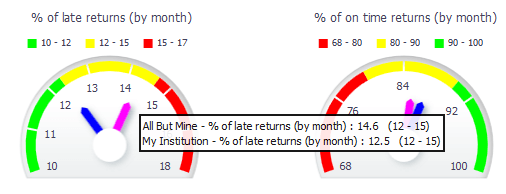
That’s why we made Benchmark Analytics an integral part of the Ex Libris Alma library management system, accessed through an out-of-the-box customizable dashboard of key performance indicators. You can create unique on-demand reports, with graphic representation of anonymized metrics for hundreds of libraries, the average of all the results, and where your institution falls in the spectrum.
Like all other Alma reports, Benchmark Analytics can be customized as needed. Each institution is given a detailed profile, making it possible to apply any of several filters to restrict the displayed data by institution type, student body size, collection development spending, and more. Outliers, defined by selecting a percentage of high or low values, can also be excluded from the results for more informative analysis. You can measure the KPIs on a monthly or yearly basis, with the option of dynamically displaying changes over time using a slider.
The KPIs you can track include inventory, loans, borrowing and lending requests, acquisitions, and resource usage. You can also see variously collated results in dashboard tabs like KPI Watchlist and My Trends.
Let’s take a look at a practical example.
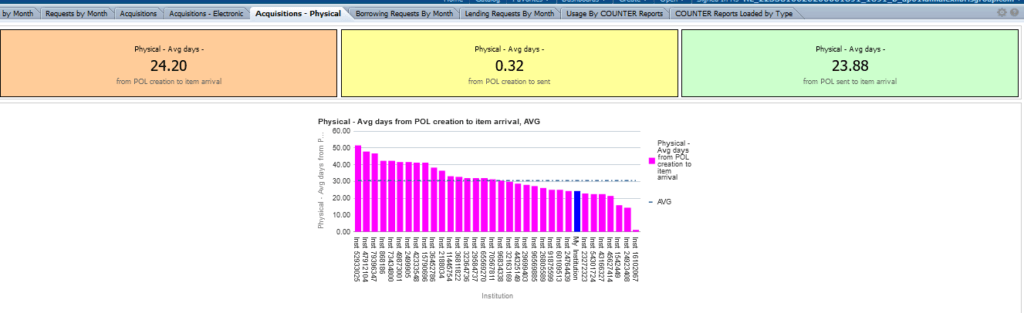
In a Benchmark Analytics report, an institution sees that the time between ordering a physical item and its arrival at the library is significantly longer than average among comparable institutions.
The librarians consider several possible reasons for this situation:
- Between the time the order is created until the time it is sent to the vendor takes too long, due to an inefficient review process.
- The review process is fine, but certain vendors are taking an unusually long time to process orders.
- The vendors are not the problem; within the institution, the items are not being sent to the acquisitions librarian fast enough.
The librarians return to the Benchmark Analytics interface for a deeper look into the acquisitions workflow. The dashboard displays the average time it takes for the institution to complete each stage of an acquisition, which provides an immediate insight into where exactly the bottleneck is. Armed with this measurable, clear and unequivocal indicator, the library can take the appropriate action – in house fixes, process optimizations, or clarifications with their vendors – and improve its services for all its patrons.