Beth McGough, Communications and Creative Services Manager, ProQuest
An interview with Michael Levine-Clark, Dean and Director of the University of Denver Libraries
Data alone cannot tell an actionable story – it must be taken in context with an understanding of the bigger picture. Then you can begin to understand what it all means.
Michael Levine-Clark, Dean and Director of the University of Denver Libraries, shared this advice during our conversation on how libraries can use data to make decisions.
At the University of Denver Libraries, deep data analysis has changed how the library builds collections, saved money, and resulted in a broader, deeper collection. Data analysis on the library’s print collection resulted in the decision to move a large portion of the collection offsite freeing up space for students – sparking increased usage of the library and easier access to library services.
Working together: Data across the library
I asked Michael why a library should put time and resources into deep data analysis, rather than other activities. He remarked data can inform a library about what activities it should focus on and how to target spending.
Michael recognized that time is a constant challenge. Large and small libraries would likely approach data analysis differently.
Large libraries could have librarians with expertise in statistical analysis, while a smaller library may pool resources and work as a team.
Regardless of a library’s size, he underlined the importance of working broadly across the library to bring in expertise on different types of resources and services.
Michael elaborated, working as a group leads to a better understanding of data and ultimately better decisions.
Sharing expertise, a library can identify usage expectations for different types of resources and users. He said context is crucial, which can be provided by experts from across the library.
Michael provided guidance for libraries that decide put their focus on usage data. He warned not to make quick decisions based on one look at data. Look at it from as many angles as possible to understand patterns by subject, discipline, and resource type, among other categories.
His advice to libraries is to be careful when benchmarking against other institutions because each library has unique strengths. A library should also benchmark against itself over multiple years. Libraries can’t understand metrics, such as the acceptable level of journal usage, without a couple years of data.
As libraries start this process, Michael suggests focusing on one type of data such as subject or type of resource. When a library has a full understanding of that category the analysis can expand.
Privacy, data, and unintended consequences
As the conversation shifted to privacy, Michael stated that aggregated data, such as a report from a vendor or publisher, does not present privacy issues.
Privacy issues arise when that information is connected with students. It is valuable to libraries to understand the usage patterns students’ exhibit and track them to see how the library contributes to student success. But this is where libraries can run into privacy issues. Michael emphasized that a library would not want to track students so closely that all the books they read could be identified. Anonymized data helps libraries prove their value and identify what works.
Michael commented on students’ willingness to share information with the library. He suspects if asked, students would share data but he emphasized the danger of unintended consequences, even if data is used with permission.
Data presentation and tools
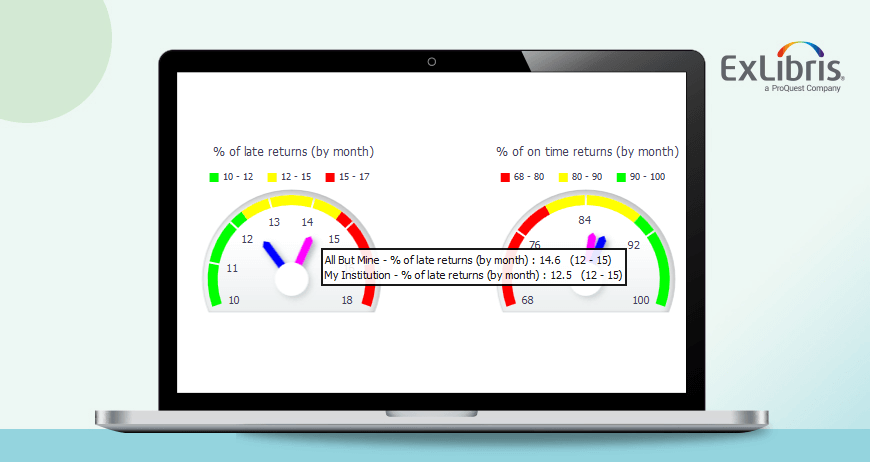
Next, we discussed tools and presenting data. The top tool Michael recommends starting with is Excel. If a library has expertise with statistical tools they can be useful but are not necessary. He underscored that analysis doesn’t need to be perfect. Michael pointed out the importance of visualizing data to tell a story and suggested Tableau for visualization.
When the time comes to present data to university administrators Michael stressed the importance of keeping the report simple but telling as complex a story as possible.
Michael emphasized data presentations should not be in librarian-ese.
Speak in context for someone outside the library and translate the jargon. He pointed out that high-level administrators receive similar reports from across the university. The library’s report should be brief and visual. With experience you will learn what administrators respond to, some like to see the underlying data while others prefer the visualizations.
Ultimately, Michael said, it is about learning how to communicate.
This post was originally published on the ProQuest Blog
You might also be interested in

Alma
Analytics
May 18, 2021 |
3 min read
Benchmarking Your Library on a Global Scale
Analytics
Community
Library Discovery
November 16, 2017 |
0 min read
Ex Libris Experts Talk: Brent Cook on Library Analytics
Analytics
Community
Library Discovery
November 16, 2017 |
0 min read
Ex Libris Experts Talk: Brent Cook on Library Analytics
Great library experiences start with software
Download whitepaper
Analytics
Community
Library Discovery
November 16, 2017 |
0 min read
Ex Libris Experts Talk: Brent Cook on Library Analytics
Analytics
Community
Library Discovery
November 16, 2017 |
0 min read
Ex Libris Experts Talk: Brent Cook on Library Analytics
Analytics
Community
Library Discovery
November 16, 2017 |
0 min read
Ex Libris Experts Talk: Brent Cook on Library Analytics
Analytics
Library Discovery
October 26, 2017 |
0 min read
Ex Libris Experts Talk: Christine Stohn on Big Data Analytics
Analytics
Library Discovery
October 26, 2017 |
0 min read
Ex Libris Experts Talk: Christine Stohn on Big Data Analytics

